Using Tracy Profiler
Tracy Profiler is a real-time profiler for C++ applications that I’ve been using in my recent projects. Unlike traditional sampling profilers, Tracy provides exact timing data with minimal overhead.
This guide shows how to integrate Tracy with an existing CMake project and capture your first profile. The instructions assume Ubuntu 22.04, though the process is similar on other platforms.
Tracy consists of two components: client-side macros that you embed in your code, and a viewer application that receives and displays the profiling data in real-time.
Project Integration
First, clone the Tracy repository into your project directory:
git clone https://github.com/wolfpld/tracy
Next, update your project’s CMakeLists.txt to include Tracy:
include_directories(
  include
  tracy/public
  ...
)

option( TRACY_ENABLE "" ON)
add_subdirectory(tracy)

add_executable(<your_project>
  tracy/public/TracyClient.cpp
  ...
)

target_link_libraries(<your_project>
  Tracy::TracyClient
  ...
)
Now compile your project in debug mode:
mkdir build && cd build
cmake -DCMAKE_BUILD_TYPE=DEBUG ..
make
Building the Tracy Viewer
The Tracy viewer compiles from source to ensure compatibility with your client version. First, install the required dependencies:
sudo apt install libglfw3-dev libfreetype-dev libcapstone-dev libdbus-1-dev
Then build the viewer. For X11 systems:
cd tracy/profiler/build/unix
make LEGACY=1
For Wayland systems:
cd tracy/profiler/build/unix
make
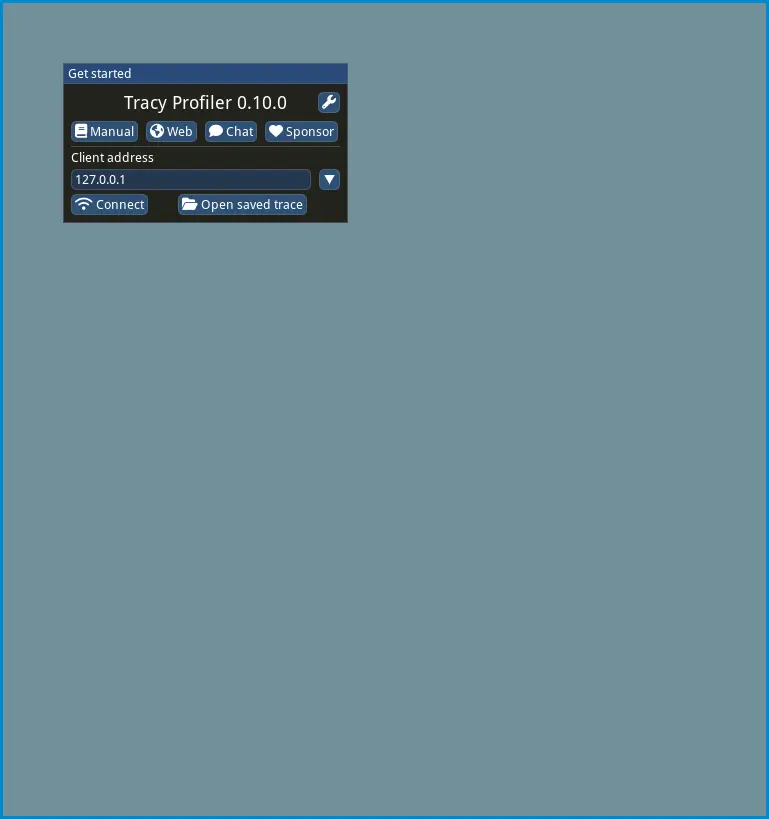
This creates a binary called Tracy-release in the build directory. Launch it with:
./Tracy-release
The Tracy viewer interface will appear:
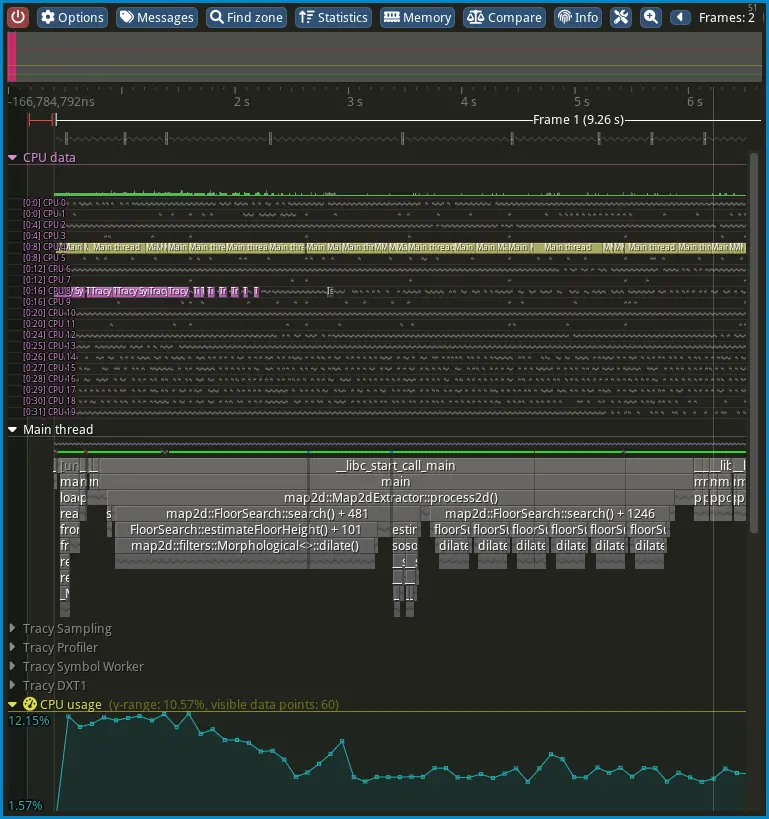
Running Your Application
With the Tracy viewer running, you can now profile your application. Running with sudo allows Tracy to access system performance counters for more detailed profiling:
cd build
sudo ./<your_project_executable>
Once your application starts, Tracy will display real-time profiling data: